How to enable the debug mode on WordPress
Marc Wagner
June 9, 2021
WordPress has a built-in debug mode that allows you to save errors, warnings and hints in a separate log file.
How do I activate the debug mode? #
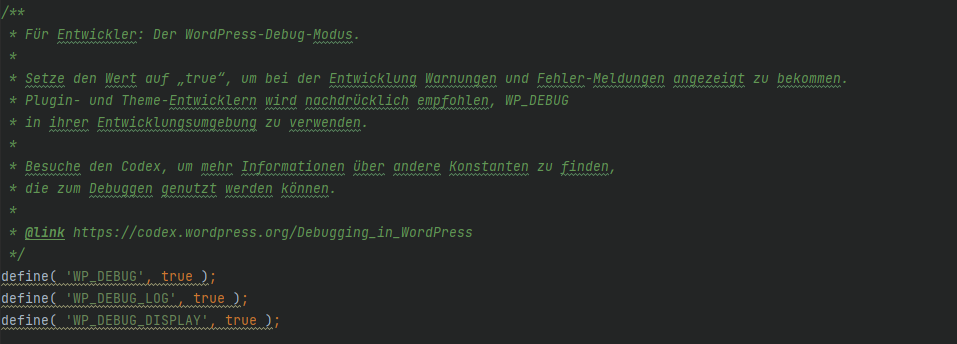
You can activate the debug mode of WordPress directly in the wp-config.php. This is located in the root directory of your WordPress installation.

define('WP_DEBUG',true);Now the debug mode is activated, and error messages are stored in the log file.
WP_DEBUG_LOG #
Using WP_DEBUG_LOG, you can specify whether the messages should be stored in the log file or not.
define('WP_DEBUG_LOG', true); // true | falseYou can also use the parameter to save your log file to another location:
define('WP_DEBUG_LOG','tmp/my-custom-error.log');But for this to work, you need to have the debug mode enabled via WP_DEBUG.
WP_DEBUG_DISPLAY #
You can also display the error messages in the browser. For this, you use the parameter WP_DEBUG_DISPLAY.
define('WP_DEBUG_DISPLAY', true); // true | falseWarning: If you use WP_DEBUG_DISPLAY, visitors of your site can of course also see the error messages.
Note: If you are using a cache like WP Rocket, autoptimize or similar, you may need to clear it first to see the error messages.
WP_DEBUG_DISPLAY enables (true) or disables (false) the output of error messages directly in the browser.
Where can I find the log file on WordPress? #
You can find the log file of WordPress under:
wp-content/debug.log
However, it is also possible that the location has been changed. For this, you can look in the wp-config.php.
Check whether an entry WP_DEBUG_LOG was stored. The new path should also be stored there.
How can I change the location for the log file? #
You can change the location for the log file at any time in the wp-config.php. The wp-config.php is located in the root directory of your WordPress installation.
Add the following there (if this entry does not already exist):
define('WP_DEBUG_LOG','/tmp/my-custom-log.log');With this, the new log file should be used from now on.
Note: For this to work, you must of course enable debug mode.
How to analyze the WordPress log file #
If an error occurred on your side, and you check the log file, you probably won’t understand anything at first.
First, very importantly, find out when the error occurred. All entries are provided with a timestamp. So you can already exclude a lot of entries.
Next, we still need to distinguish between:
- PHP Warning
- PHP Notice
- PHP Error / PHP Fatal Error / PHP Parse error
To find the error, we can ignore all PHP Warning and PHP Notice. The most interesting are the error messages.
If you have found an error that matches the timestamp of the problem, we have already found the cause.
But what now? Together with the error, you will also find the file that caused the error in the log file. This can look like this, for example:

Both at the beginning of the error message and at the end, it says where this error message was thrown (Thrown). In our example, the file Shortcode.class.php in the plugin f12-content-protection causes the error.
Now you can contact the plugin author, disable the plugin by simply renaming the folder, or fix the error yourself.
No matter what you do, be sure to back up your website and database.
Artikel von:
Marc Wagner
Hi Marc here. I’m the founder of Forge12 Interactive and have been passionate about building websites, online stores, applications and SaaS solutions for businesses for over 20 years. Before founding the company, I already worked in publicly listed companies and acquired all kinds of knowledge. Now I want to pass this knowledge on to my customers.

